Project overview
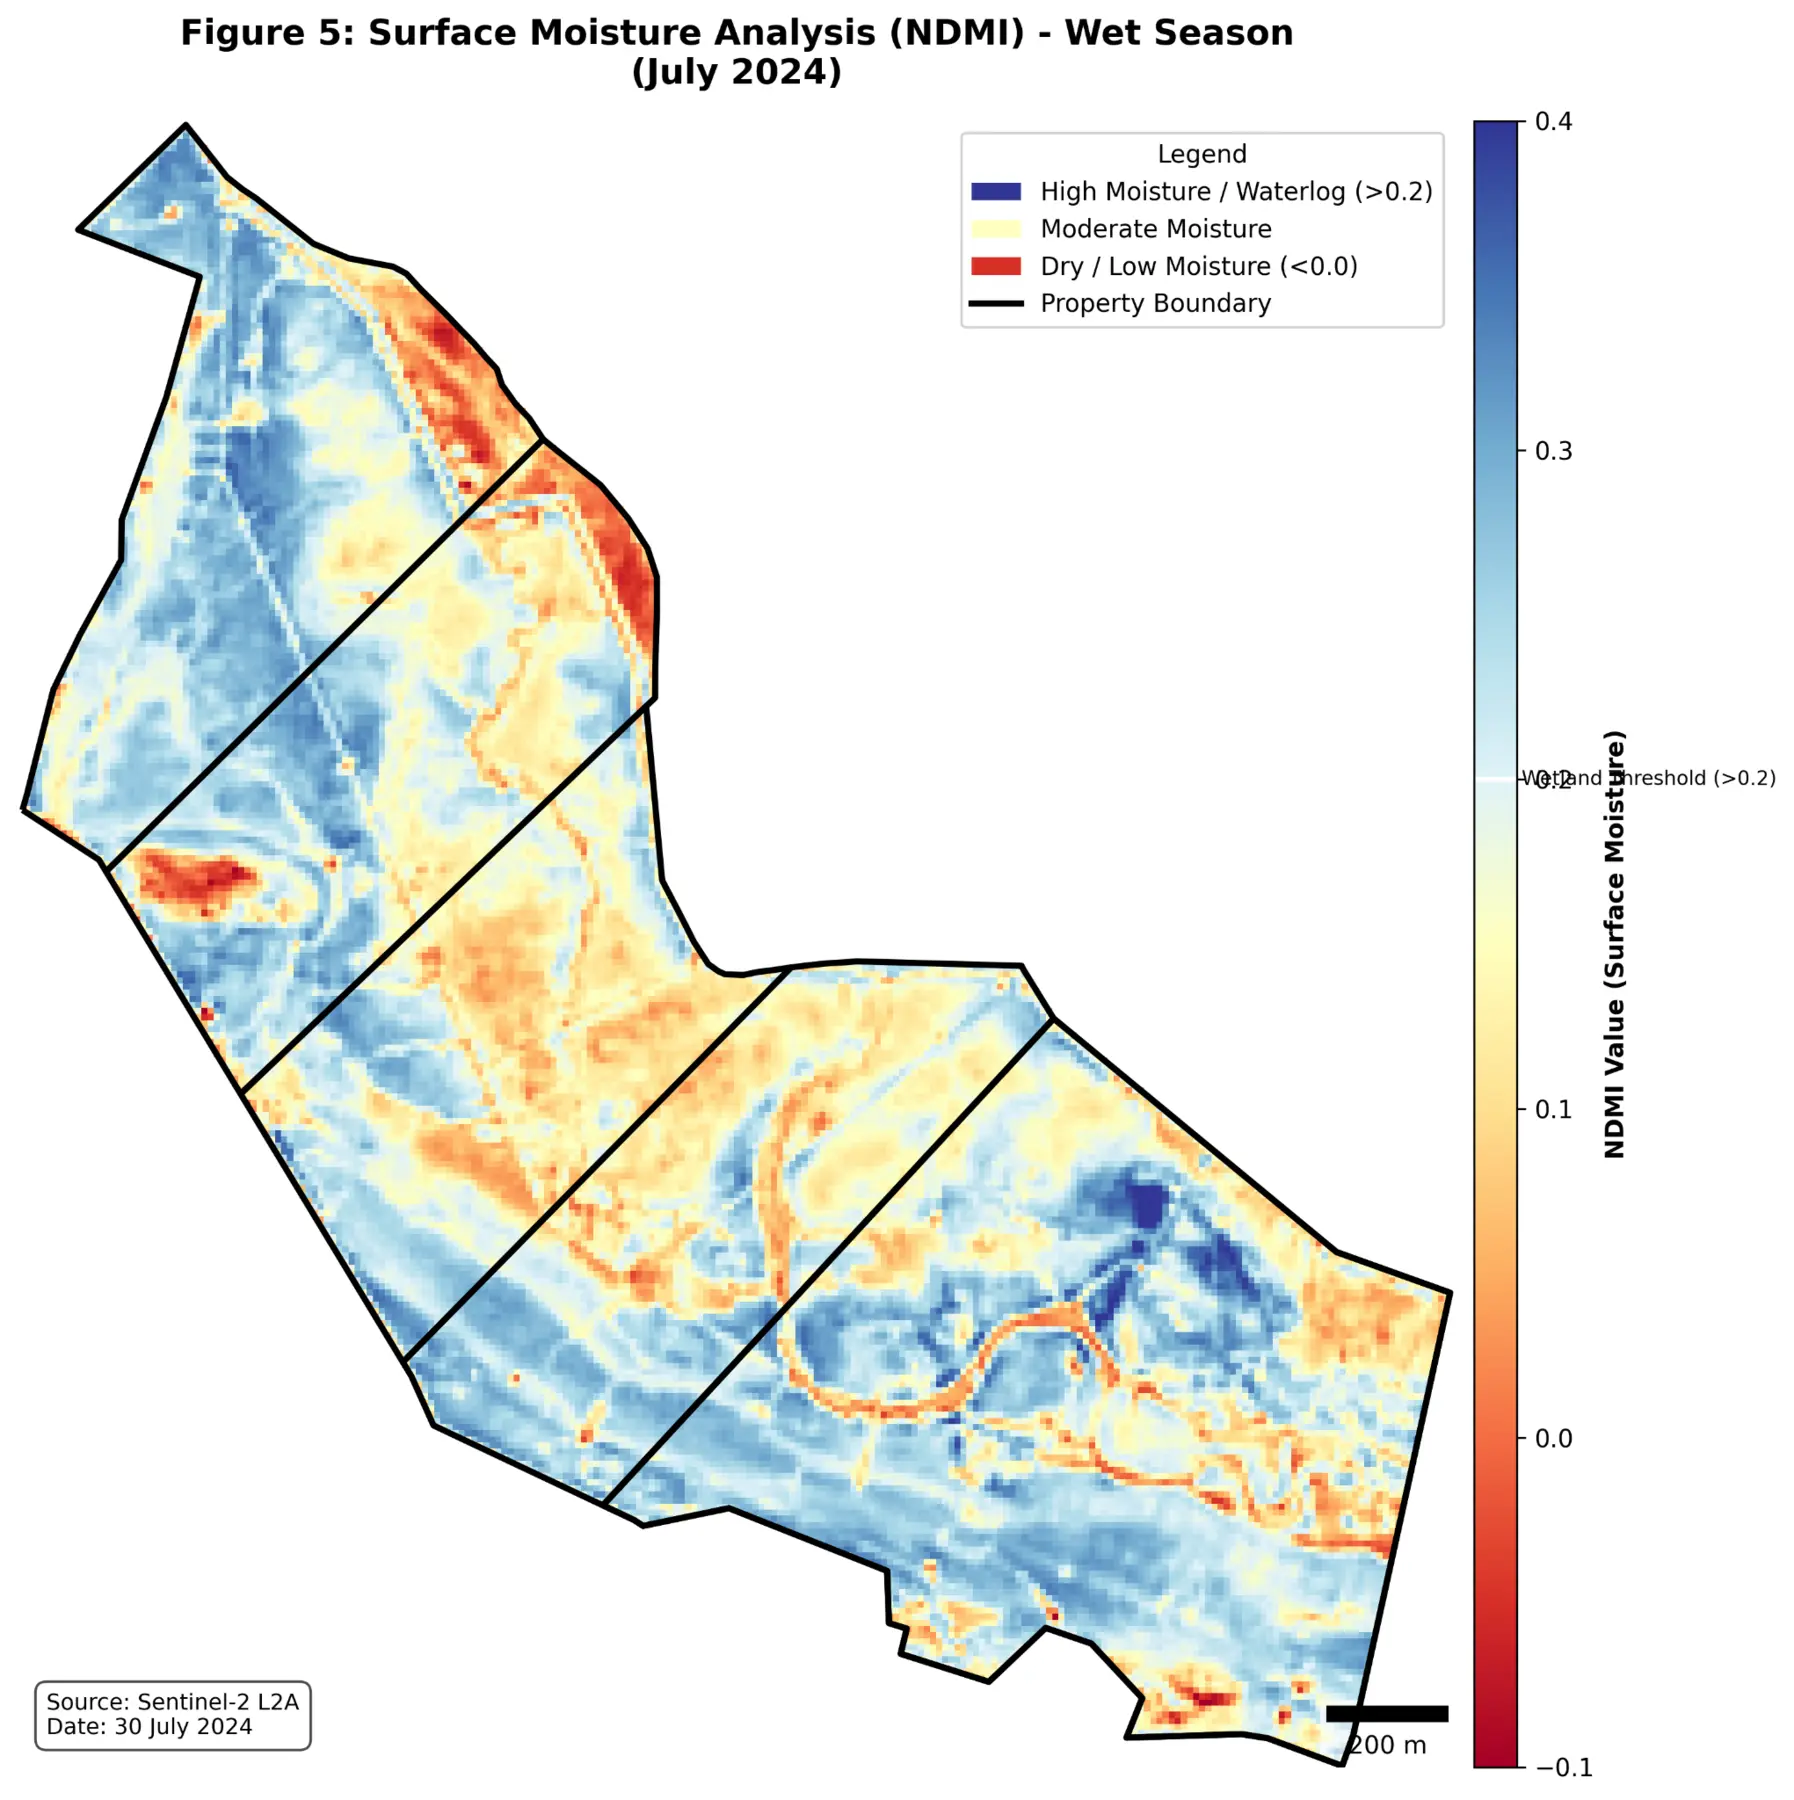
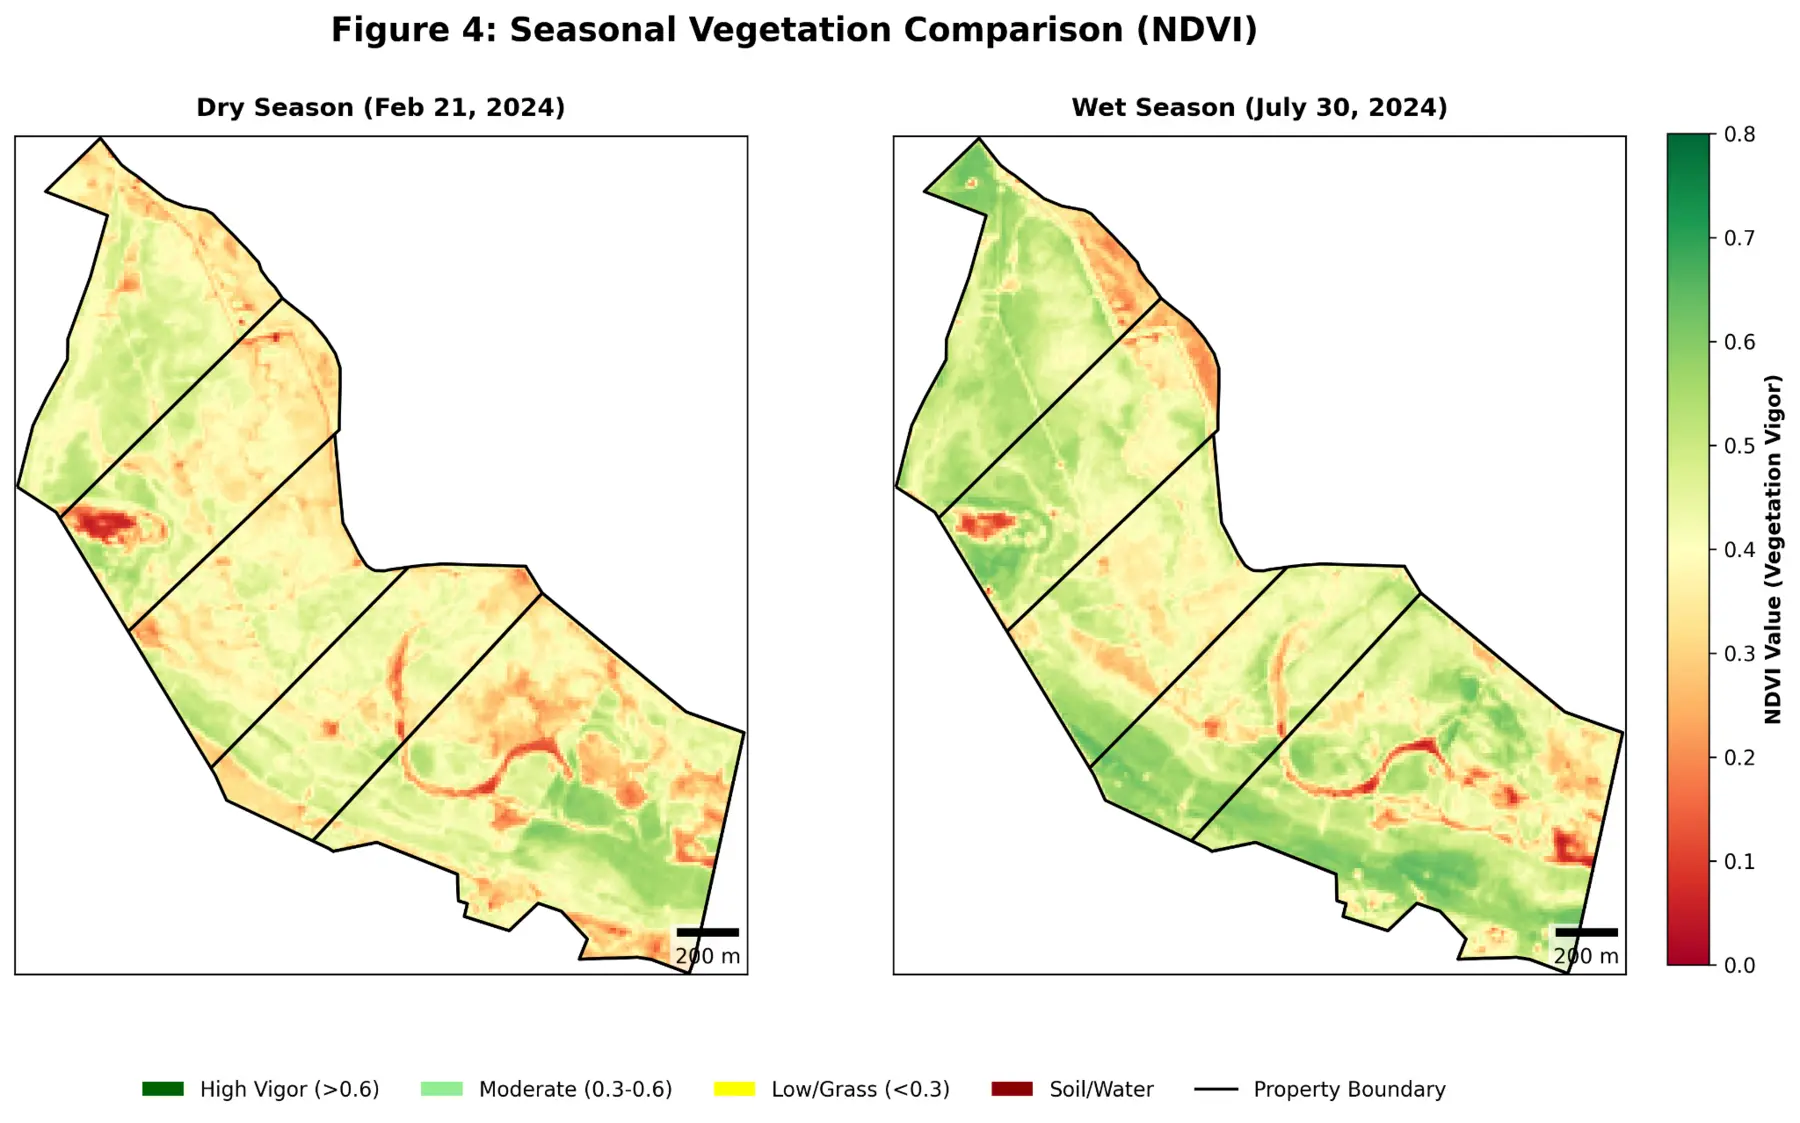
The project compared dry- and wet-season vegetation conditions using NDVI and mapped wet-season surface-moisture patterns using NDMI. The outputs highlighted vegetation stress, moisture variation, priority areas, and spatial relationships with the site boundary and local infrastructure.
The project challenge
Coastal vegetation and moisture conditions can vary strongly with season, tide, recent rainfall, and land cover. The analytical challenge was to create comparable seasonal evidence without presenting a spectral index as direct field proof.
Technical approach
- Selected imagery around comparable seasonal windows and reviewed cloud, coverage, spatial resolution, and acquisition context.
- Calculated and mapped NDVI to compare relative vegetation condition between dry and wet periods.
- Used NDMI to examine wet-season surface-moisture patterns and possible areas requiring closer review.
- Overlaid the results with the project boundary, priority locations, infrastructure, and other site context.
- Prepared an interpretation that distinguishes screening evidence from conclusions that require field verification.
Key deliverables
- Dry- and wet-season NDVI comparison maps
- Wet-season NDMI surface-moisture map
- GIS-ready raster outputs
- Priority-area and infrastructure overlays
- Technical interpretation for environmental review
Decision value
- A repeatable vegetation and moisture baseline
- Faster identification of areas for field investigation
- Clear seasonal evidence for early project screening
- GIS layers that can be combined with additional environmental data
QUALITY & INTERPRETATION
The interpretation considers seasonal comparability, cloud and sensor limitations, spatial resolution, and the fact that NDVI/NDMI are indicators rather than direct measurements of ecological condition.