Project overview
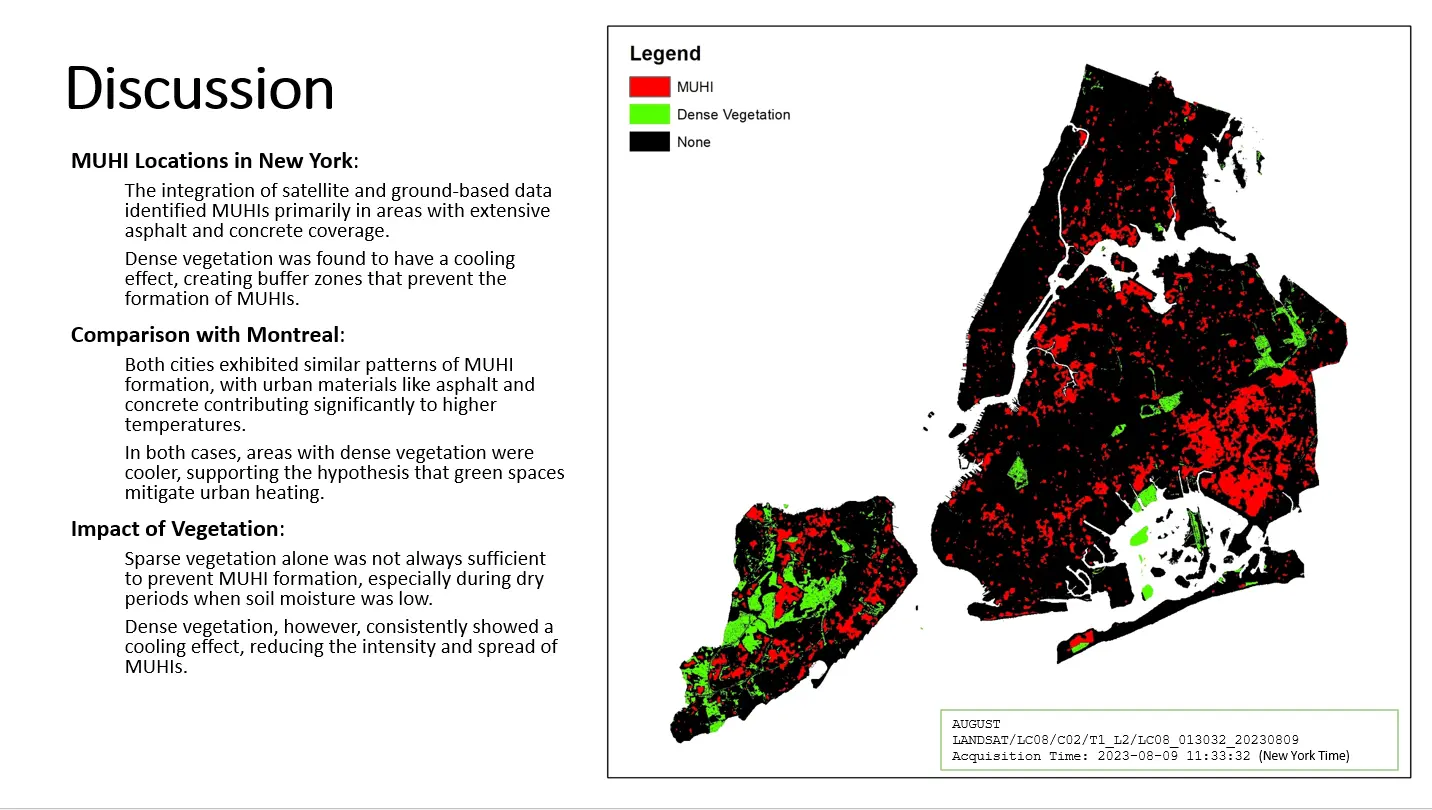
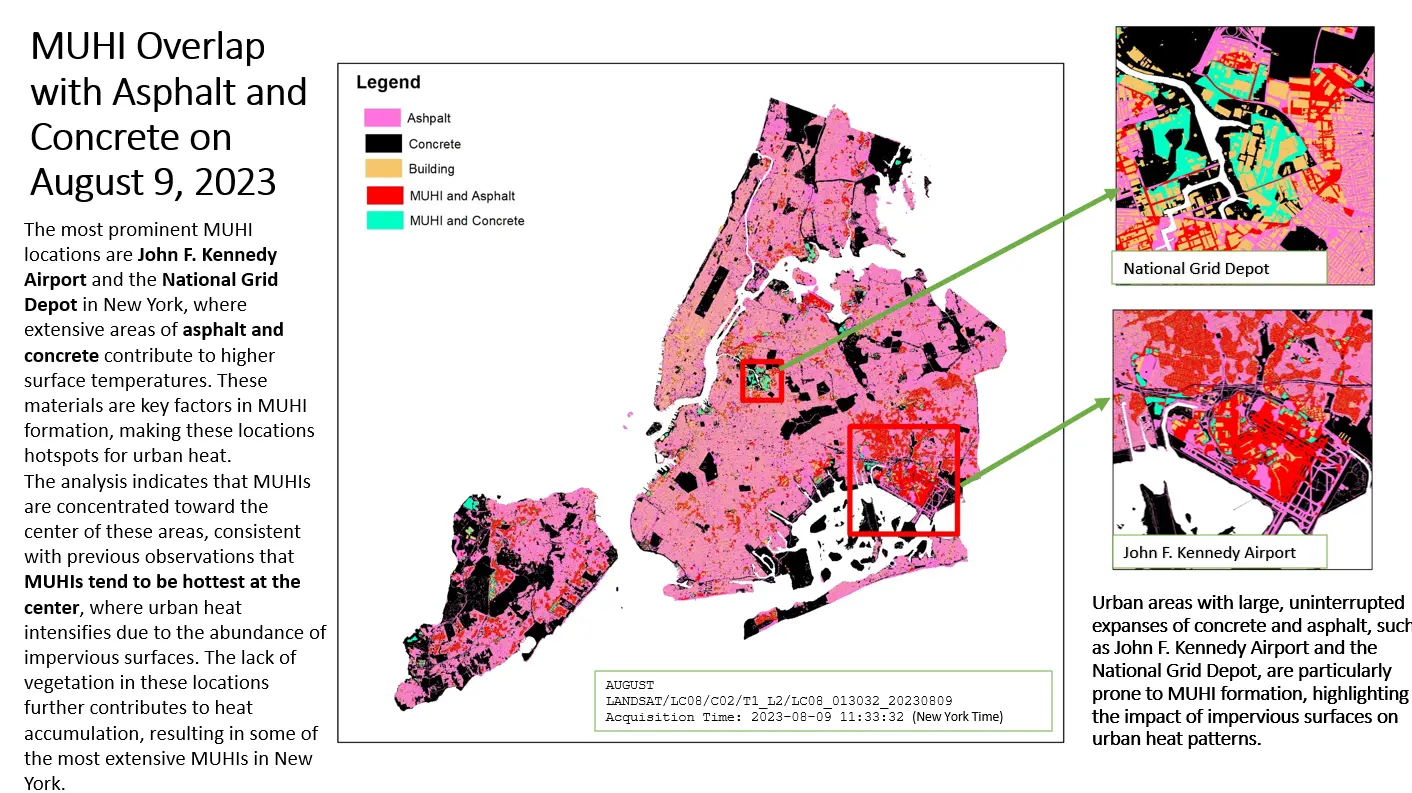
This analysis mapped micro urban heat-island patterns and examined their overlap with impervious surfaces and built-up land cover. The results help explain local thermal hotspots and support evidence-based urban greening and heat-mitigation strategies.
The project challenge
Urban heat varies at a finer scale than citywide averages suggest. The task was to identify local thermal patterns and connect them with impervious surfaces, buildings, and vegetation in a way that could support practical mitigation discussion.
Technical approach
- Prepared land-surface-temperature information and a consistent study boundary.
- Mapped high-temperature areas and reviewed their spatial concentration rather than relying on one summary statistic.
- Compared hotspot patterns with asphalt, concrete, buildings, and green-cover information.
- Examined where impervious land cover and thermal hotspots overlap and where vegetation may moderate local conditions.
- Translated the findings into a discussion of priority areas and appropriate limitations for urban-climate interpretation.
Key deliverables
- Micro urban heat-island map
- Impervious-surface overlap analysis
- Built-form and vegetation comparison
- Priority-area visualisation
- Interpretive presentation material
Decision value
- Evidence for targeted greening or shade interventions
- A spatial basis for discussing heat exposure
- More local detail than a single citywide temperature figure
- A reusable method for monitoring future land-cover change
QUALITY & INTERPRETATION
Land-surface temperature is not identical to experienced air temperature. Acquisition time, season, material properties, shade, and atmospheric conditions are treated as interpretation constraints.